
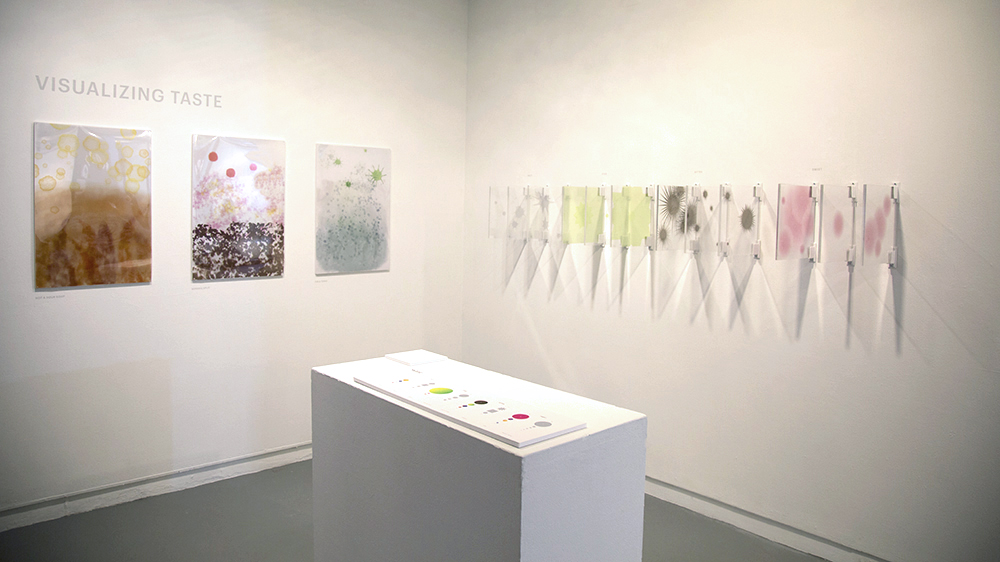
Visualizing Taste
Rachel Minier
Visualizing Taste is an exploration in how design can be used to interpret and represent abstract concepts, as well as how it can inspire a deeper, more thoughtful, and ideally better relationship with food.


Rachel Minier
Visualizing Taste is an exploration in how design can be used to interpret and represent abstract concepts, as well as how it can inspire a deeper, more thoughtful, and ideally better relationship with food.
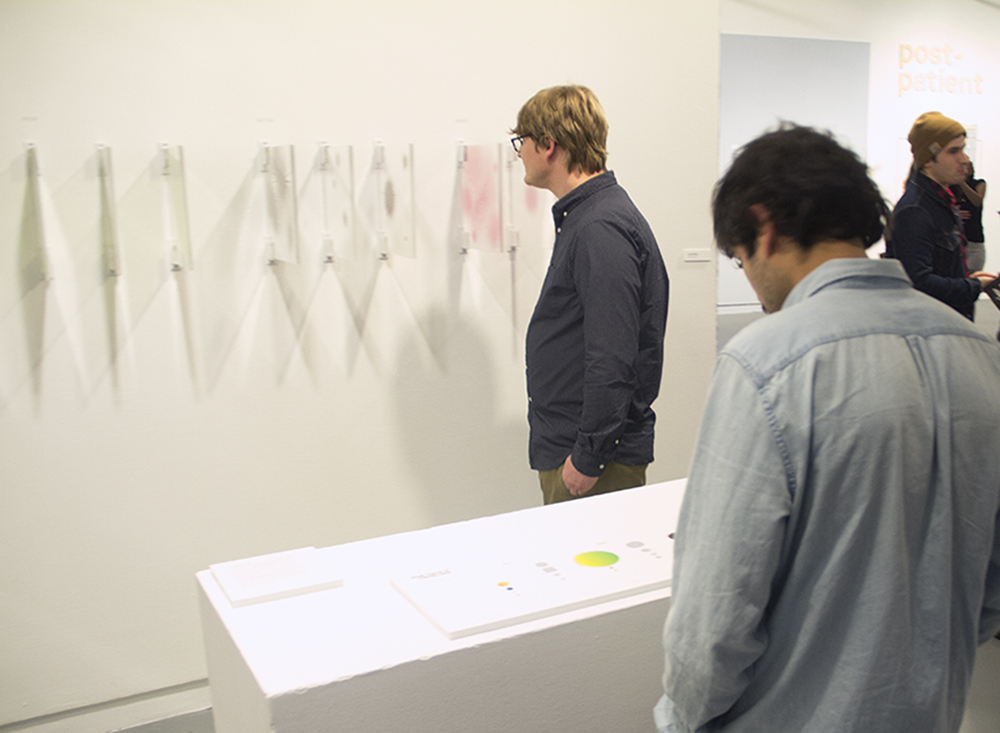
The components for this exhibition were created using feedback from a questionnaire (shown on pedestal) on people’s perceptions of the colors and shapes of basic tastes (salty, sour, bitter, sweet).
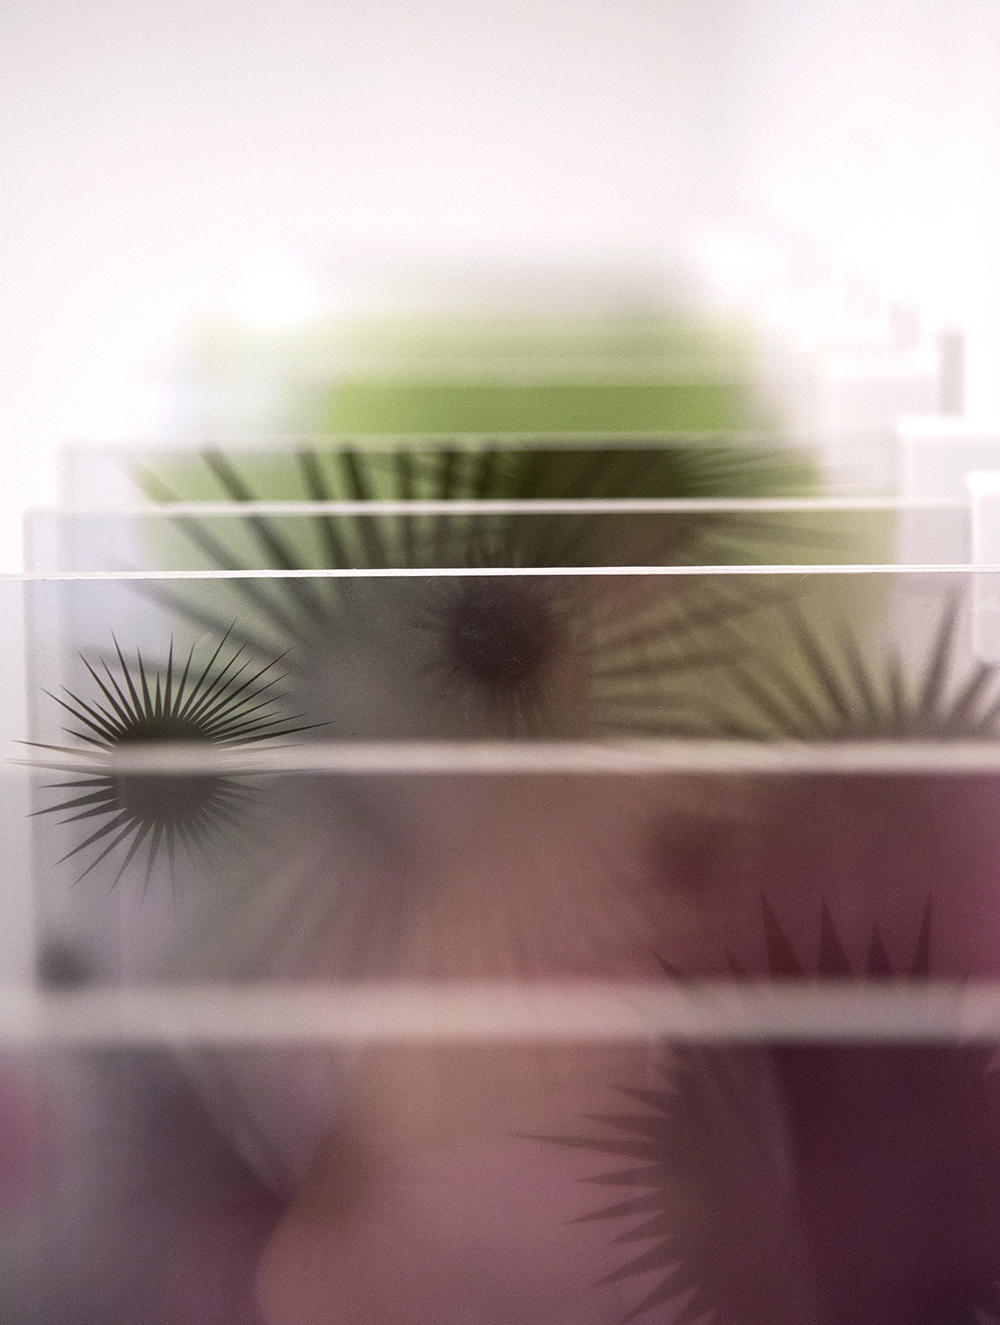
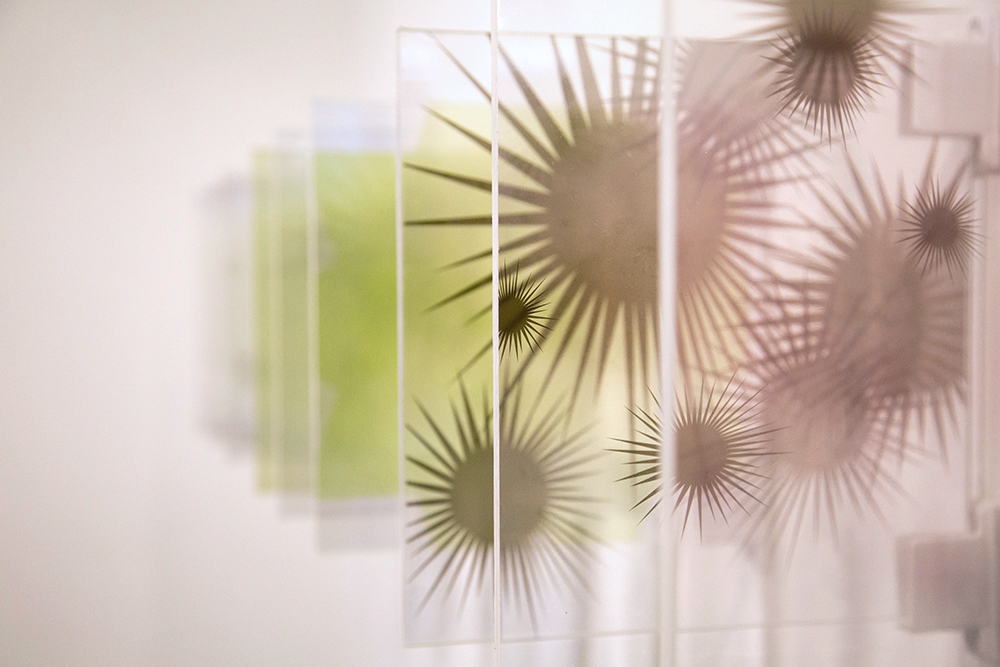
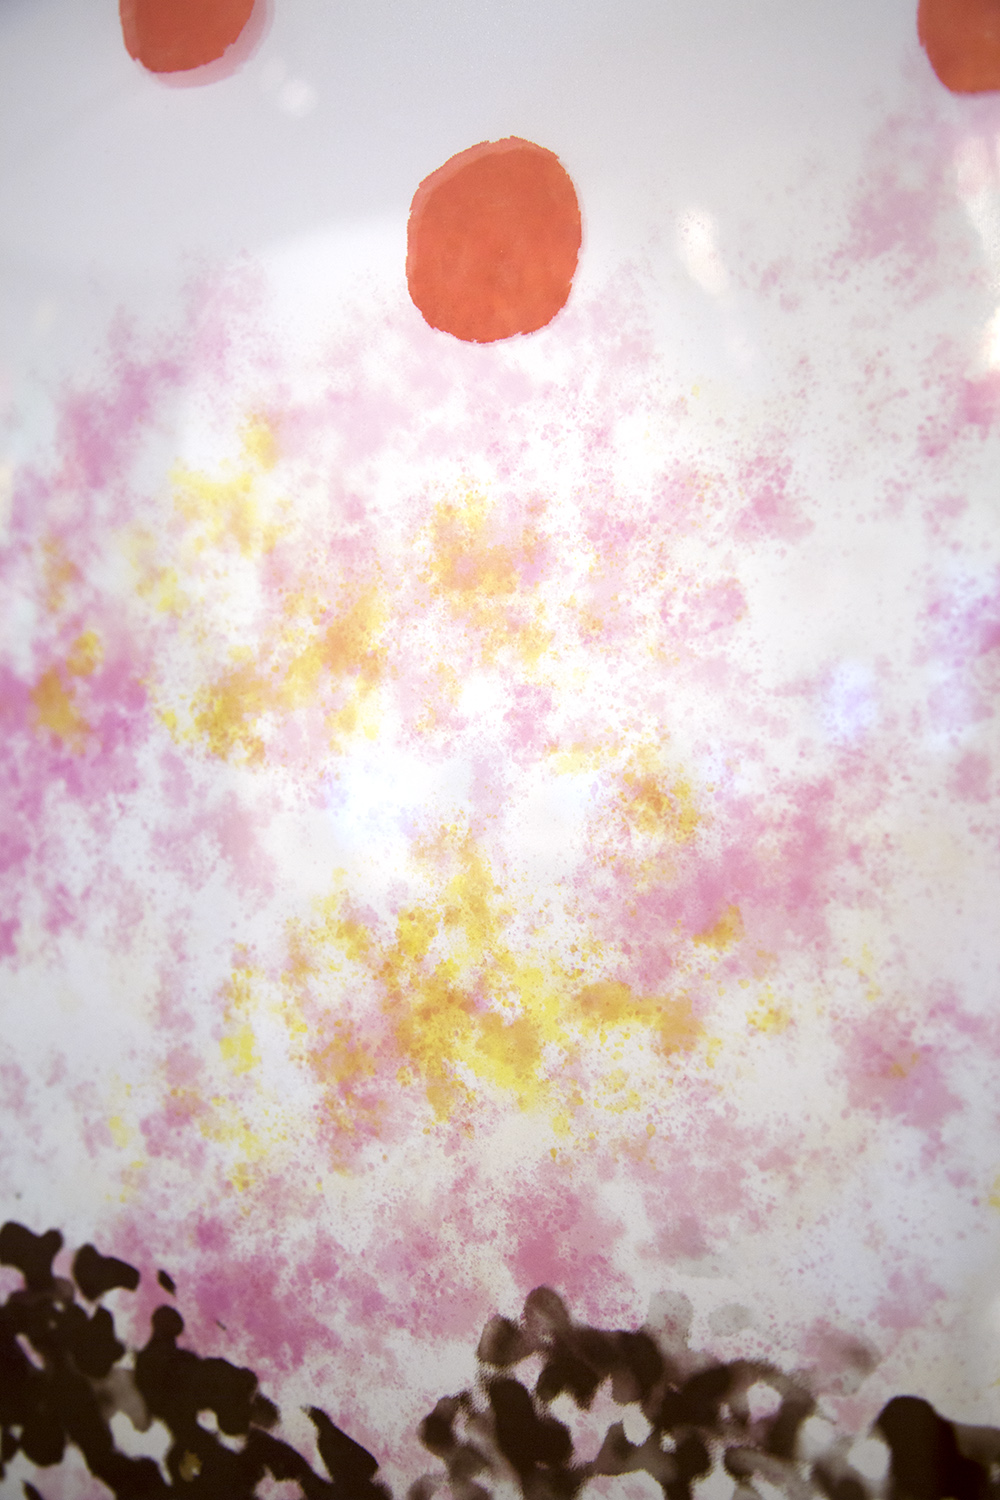
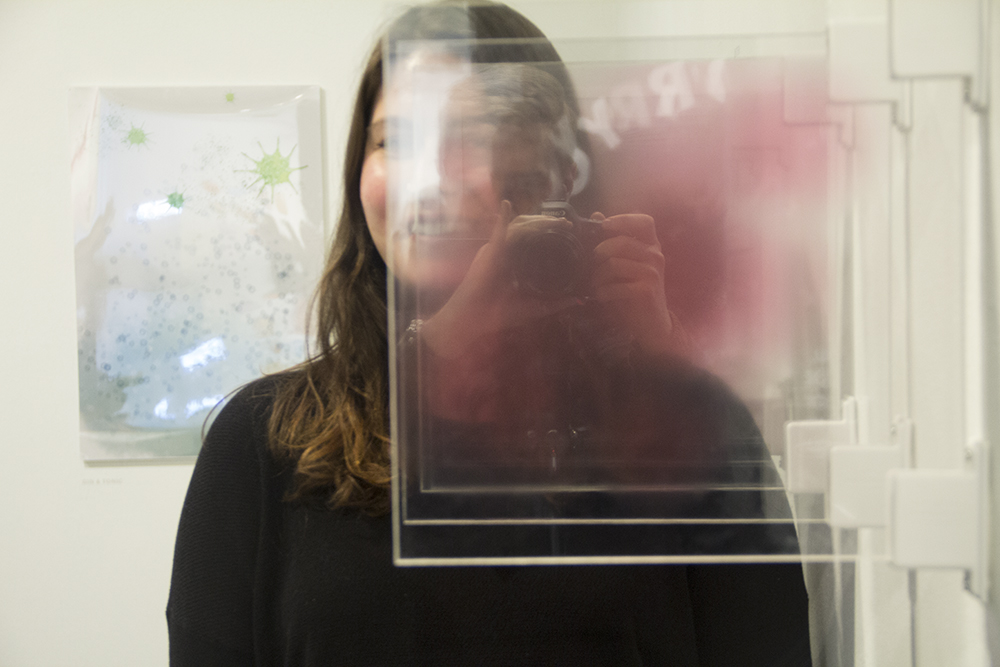
The mounting of the Taste Visualizations allowed viewers to explore a variety of angles and overlaps.
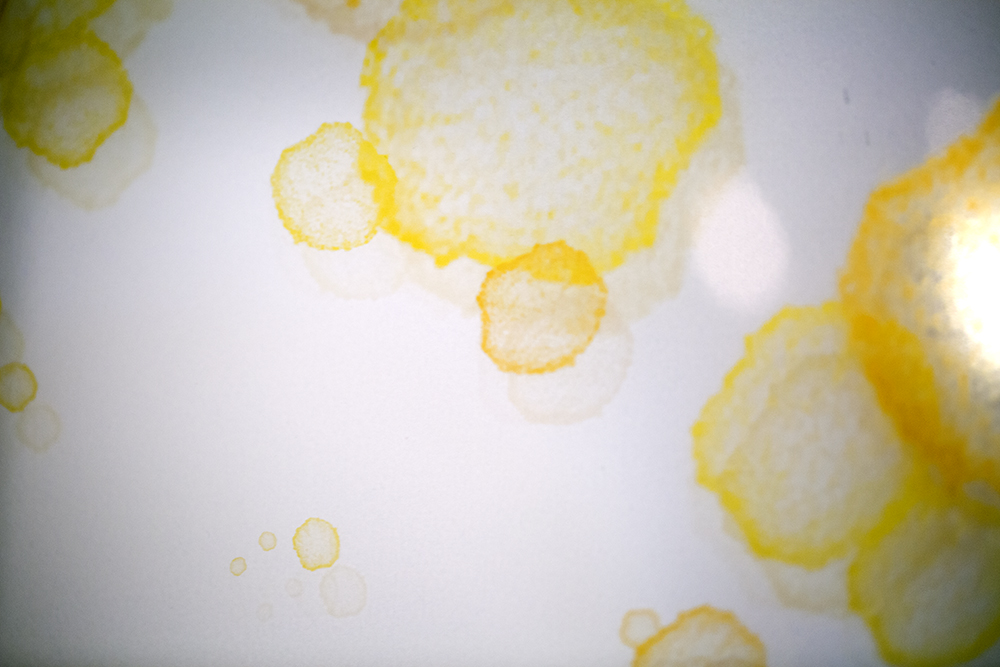
For the exhibition, stills from the taste videos were printed on transparency and sandwiched between sheets of acrylic.
Saltiness proved to be one of the most divisive tastes in terms of visualization. While most consider the color to be white, responses for shape included round/oval, square/rectangular, and jagged, and were all quite closely ranked.
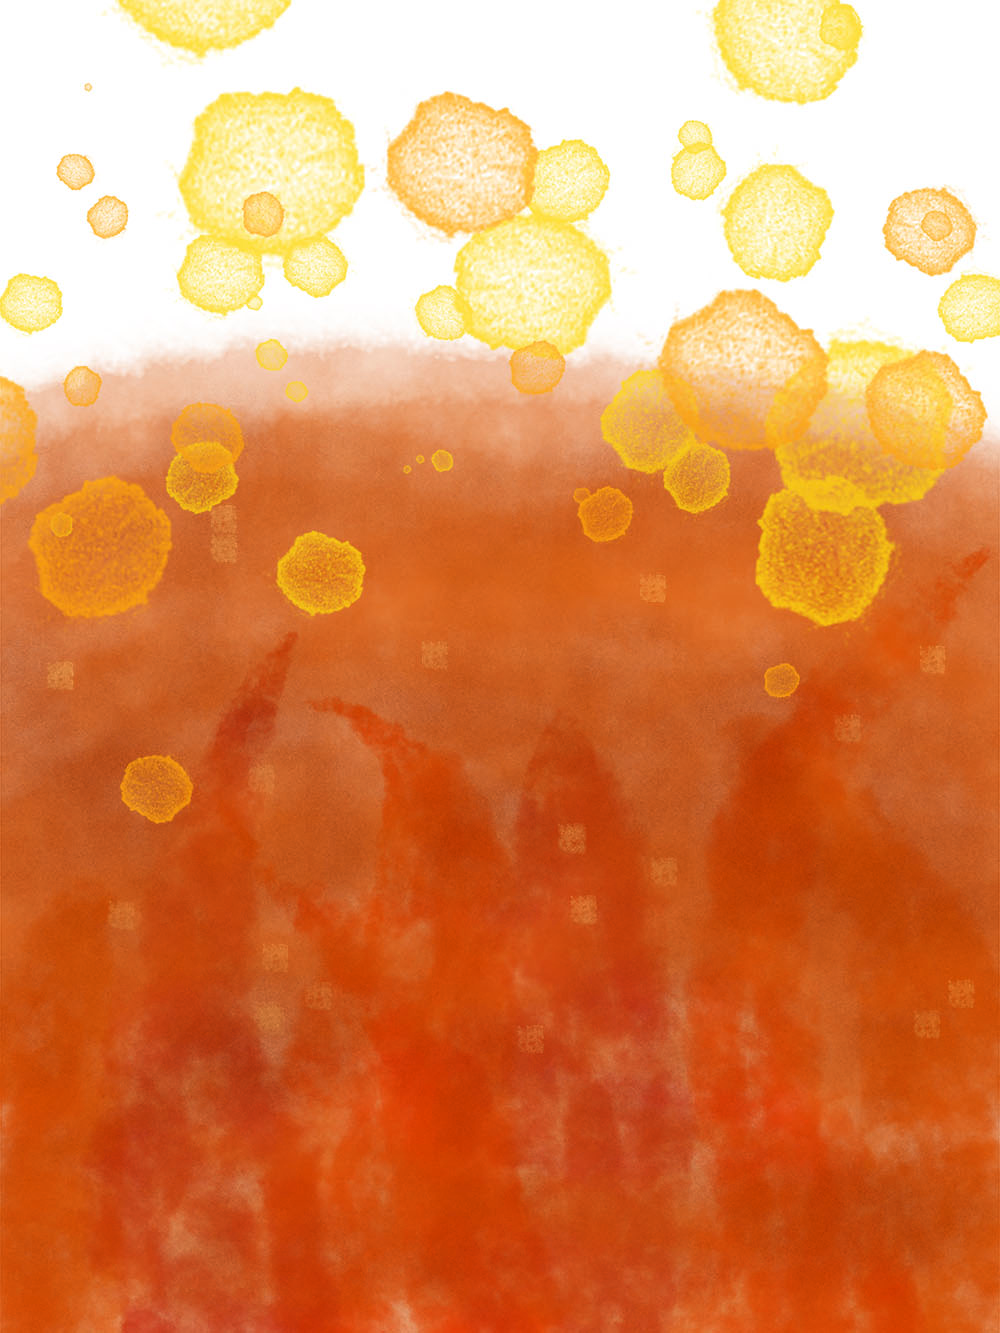
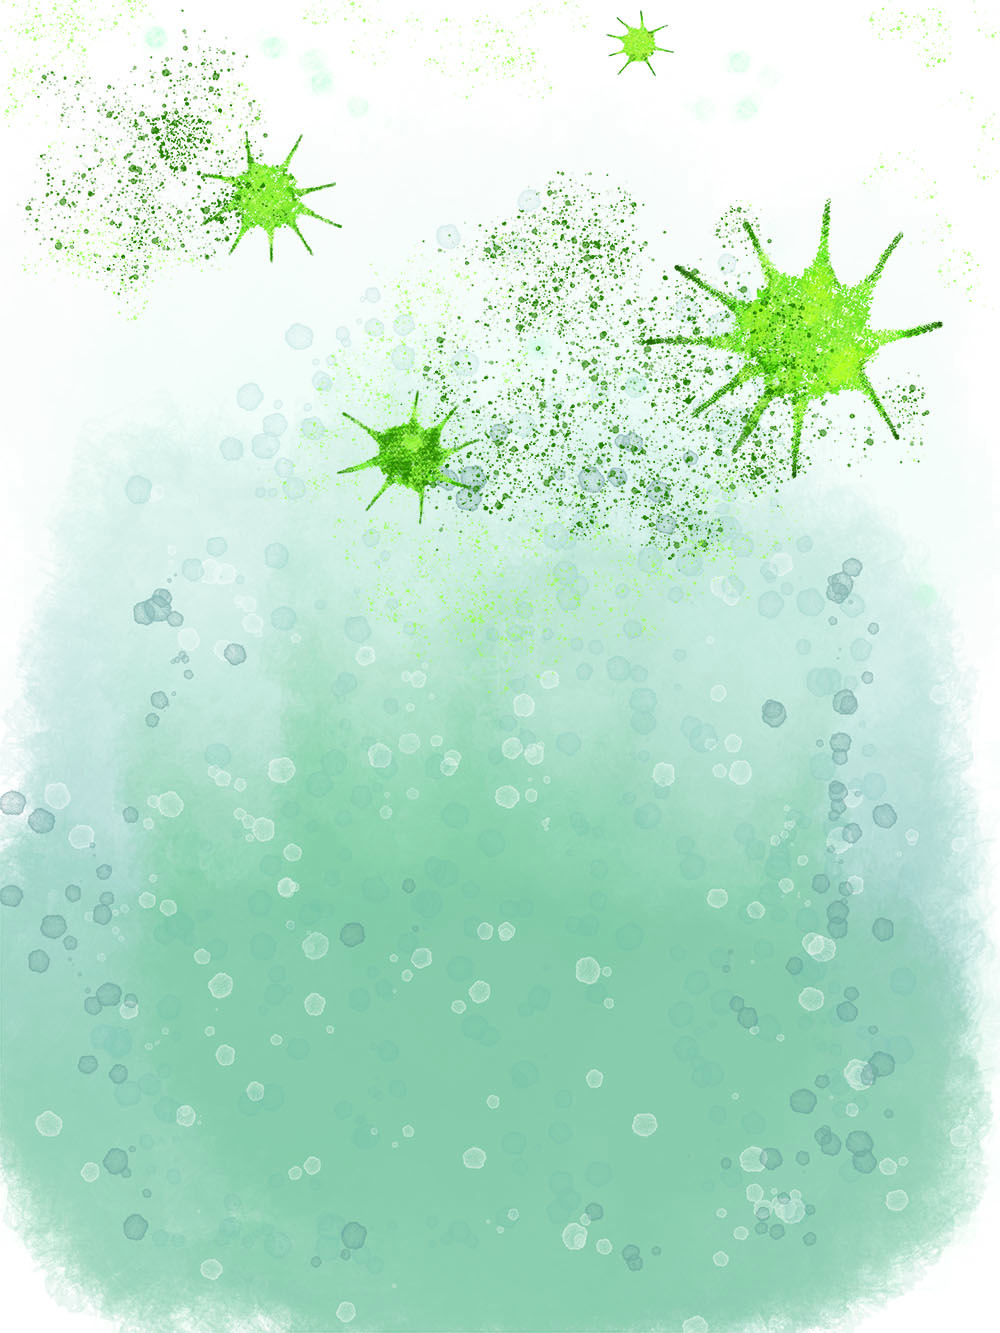
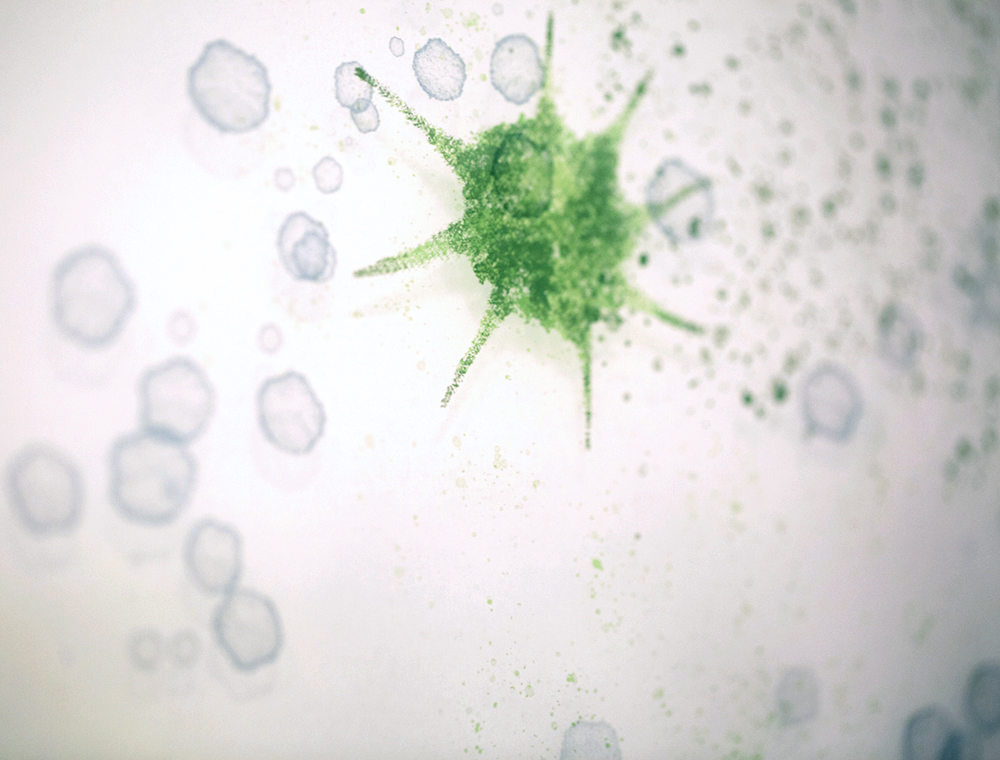
Of the four, sour had the highest number of consistent responses for color and was overwhelming considered to be yellow/green.
Three Food Landscapes were created using the data collected from the taste questionnaire, as well as information on top, middle, and low notes of a dish. This one represents hot and sour soup.
These were printed on transparency in three layers and mounted for the exhibition.
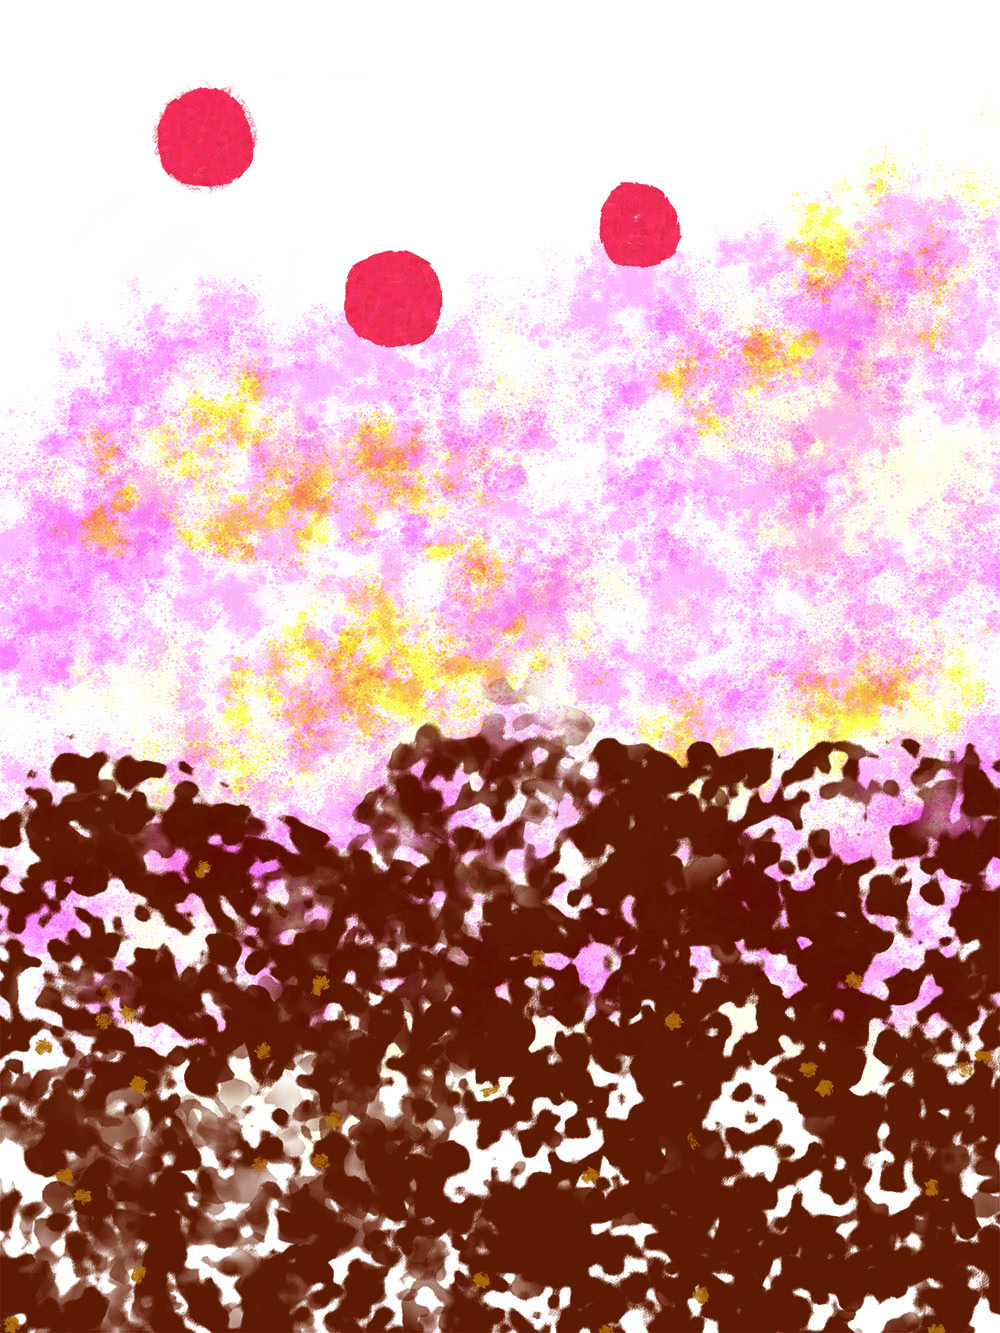
A banana split visualization.
A visual gin and tonic.